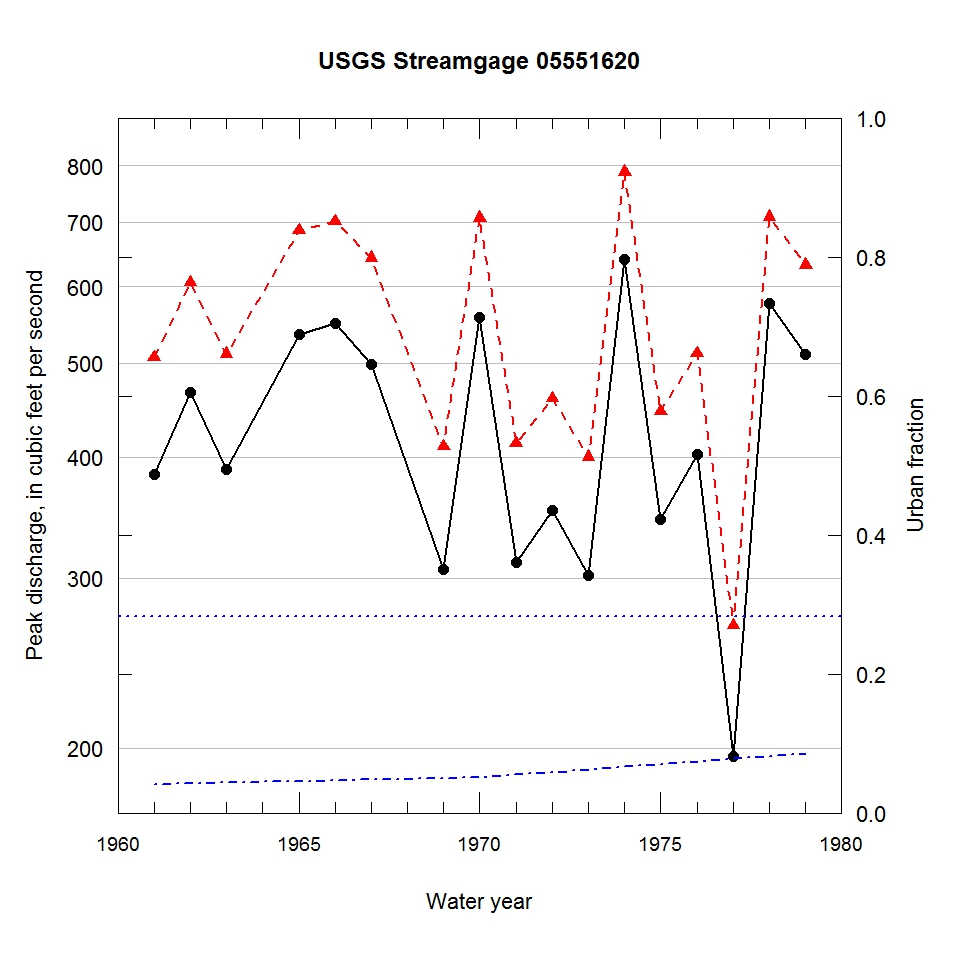
Observed and urbanization-adjusted annual maximum peak discharge and associated urban fraction and precipitation values at USGS streamgage:
05551620 BLACKBERRY CREEK NEAR KANEVILLE, IL


| Water year | Segment | Discharge code | Cumulative reservoir storage (acre-feet) | Urban fraction | Precipitation (inches) | Observed peak discharge (ft3/s) | Adjusted peak discharge (ft3/s) | Exceedance probability |
| 1961 | 1 | -- | 0 | 0.041 | 1.219 | 384 | 507 | 0.580 |
| 1962 | 1 | -- | 0 | 0.042 | 0.300 | 466 | 606 | 0.438 |
| 1963 | 1 | -- | 0 | 0.043 | 1.249 | 388 | 511 | 0.574 |
| 1965 | 1 | -- | 0 | 0.046 | 0.161 | 536 | 686 | 0.348 |
| 1966 | 1 | -- | 0 | 0.047 | 1.381 | 550 | 701 | 0.333 |
| 1967 | 1 | -- | 0 | 0.048 | 1.073 | 499 | 642 | 0.395 |
| 1969 | 1 | -- | 0 | 0.050 | 0.875 | 306 | 410 | 0.717 |
| 1970 | 1 | -- | 0 | 0.052 | 1.458 | 558 | 707 | 0.326 |
| 1971 | 1 | -- | 0 | 0.055 | 0.376 | 311 | 413 | 0.712 |
| 1972 | 1 | -- | 0 | 0.059 | 1.079 | 352 | 460 | 0.646 |
| 1973 | 1 | -- | 0 | 0.063 | 1.469 | 302 | 400 | 0.732 |
| 1974 | 1 | -- | 0 | 0.067 | 1.305 | 640 | 788 | 0.250 |
| 1975 | 1 | -- | 0 | 0.070 | 0.841 | 345 | 446 | 0.665 |
| 1976 | 1 | -- | 0 | 0.074 | 1.103 | 403 | 512 | 0.572 |
| 1977 | 1 | -- | 0 | 0.078 | 1.189 | 196 | 268 | 0.887 |
| 1978 | 1 | -- | 0 | 0.082 | 1.399 | 576 | 708 | 0.326 |
| 1979 | 1 | -- | 0 | 0.085 | 0.349 | 511 | 632 | 0.406 |

